

As a senior BI analyst who has spent years navigating the complex world of data, I have seen many newcomers make the same mistake.
They focus entirely on the “visuals” without understanding the underlying architecture. While a pretty dashboard might impress someone for a minute, a truly successful Business Intelligence solution provides accurate, reliable, and timely data that drives real business decisions.
Building an end-to-end Power BI solution is like building a house. You cannot start with the paint on the walls.
You need a solid foundation, strong framing, and proper plumbing.
For aspiring BI analysts, mastering this lifecycle is the key to moving from a junior role to a senior level where you design systems, not just charts.
In this guide, I will take you through the exact steps I follow to create professional BI solutions that provide long-term value to stakeholders.
Understanding the Business Intelligence Lifecycle

Source: paltron.com
Before we dive into the technical steps, we must understand what “end-to-end” actually means. It refers to the entire journey of data. This journey starts at the source where data is created and ends with a consumer viewing a report on their phone or laptop.
As an analyst, you are the bridge between the raw data and the business user. Your goal is to translate technical information into a language that managers and executives understand.
Phase 1: Requirements Gathering and Planning
The biggest reason BI projects fail is not technical. It is a lack of communication. Before you open Power BI Desktop, you must talk to your users.
Start by asking these questions:
- What are the key performance indicators (KPIs) we need to track?
- Who is the target audience? An executive wants a summary, while an operations manager needs the details.
- How often does the data need to be updated? Daily? Hourly?
- What are the specific business questions we are trying to answer?
By defining your requirements early, you avoid “scope creep,” which is when a project keeps growing until it becomes unmanageable. Write these requirements down and get approval before moving to the next stage.
Phase 2: Data Ingestion and The Power Query Phase
Once you have a plan, you need to get the data. This process is often called ETL, which stands for Extract, Transform, and Load. In Power BI, this happens within the Power Query Editor.
Most of your time as a BI professional will be spent here. Raw data is almost always messy. You might find dates in the wrong format, missing values, or duplicate records. Power Query is your primary tool for cleaning this data.
Best Practices for Power Query:
- Give steps meaningful names: Instead of “Filtered Rows,” use “Filter Out Cancelled Orders.”
- Remove unnecessary columns: Only bring in the data you actually need. This keeps your file size small and your reports fast.
- Use Query Folding: This is a process where Power BI pushes the transformation logic back to the source database. This is vital for performance when working with large datasets.
Phase 3: Data Modeling and the Star Schema
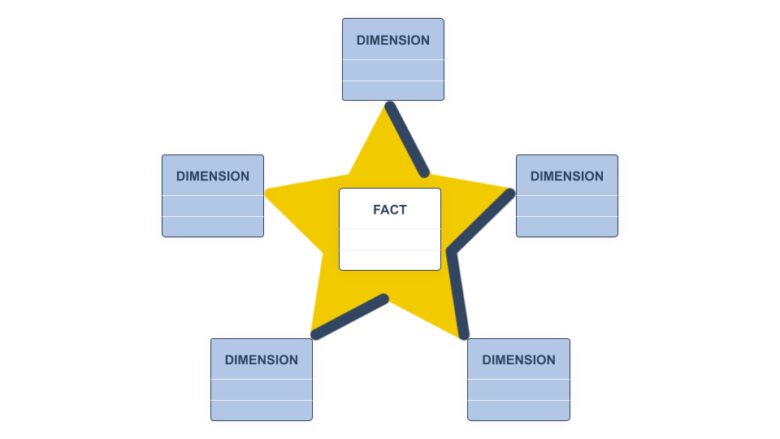
Source: hopsworks.ai
This is the most critical technical step. A common mistake among beginners is trying to put all data into one giant table. This is called a “flat table,” and it is a recipe for disaster in Power BI.
To build a scalable solution, you must use a Star Schema. In this model, you organize your data into two types of tables:
- Fact Tables: These contain the quantitative data, such as sales amounts, quantities, or costs. These tables are usually long and contain many rows.
- Dimension Tables: These contain the descriptive information about the facts, such as product names, customer details, or geographic locations.
You link these tables using relationships. Usually, this is a “One-to-Many” relationship where one product in a dimension table appears many times in the sales fact table.
Proper data modeling ensures your calculations are accurate and your report performance stays high even as data grows.
Phase 4: Developing DAX Calculations
DAX, or Data Analysis Expressions, is the formula language used in Power BI. While you can do some basic math using the standard interface, you must master DAX to create sophisticated insights.
I always recommend creating “Measures” rather than “Calculated Columns.” Measures are calculated on the fly based on the filters the user selects. This makes them much more efficient and flexible.
Focus on learning these key areas of DAX:
- Time Intelligence: Comparing this year’s sales to last year’s sales.
- Filter Context: Understanding how the visual filters change the result of your formula.
- The CALCULATE Function: This is the most powerful function in DAX, allowing you to override or modify filters within a calculation.
If you find DAX intimidating, you are not alone. It takes practice. For those who want to accelerate their learning, taking a structured Power BI Training Course can provide the mentorship and real-world projects needed to master these complex formulas.
Phase 5: Data Visualization and User Experience (UX)

Source: kaarwan.com
Now we reach the part most people are familiar with: building the dashboard. However, visualization is more than just picking a chart. It is about communication.
A senior analyst follows these design principles:
- Hierarchy: Place the most important information, like your total revenue or profit margin, at the top left. This is where the human eye naturally starts reading.
- Consistency: Use a consistent color palette. Do not use ten different colors if two will do.
- Clarity: Use the right visual for the right data. Use line charts for trends over time and bar charts for comparing categories. Avoid pie charts if you have more than two or three slices.
- Interactivity: Use features like “Drill-through” and “Tooltips” to provide deeper layers of information without cluttering the screen.
Your dashboard should answer the user’s questions at a glance. If they have to spend ten minutes clicking around to find the “why” behind a number, the dashboard has failed.
Phase 6: Publishing and Governance
After your report is built, you publish it to the Power BI Service. This is where you manage how people access your work.
As a BI architect, you must think about security. Use Row-Level Security (RLS) to ensure that people only see the data they are allowed to see. For example, a sales manager in New York should not see the data for the manager in London unless it is required.
You also need to set up a “Gateway” if your data is stored on a local server. This allows Power BI to refresh the data automatically so your users always have the latest information.
Enhancing Your Career as a BI Analyst

Source: hdatasystems.com
Building an end-to-end solution is a huge achievement, but the field of Business Intelligence is always evolving. To stay relevant, you should also look into related areas like:
- Power BI Dataflows: For creating reusable data transformation logic.
- Semantic Models: Understanding how to build a unified data layer for an entire organization.
- Paginated Reports: For those times when a business needs a pixel-perfect, printable report.
- AI Integration: Using built-in AI tools to find hidden patterns in your data.
The jump from a beginner to a senior analyst requires a commitment to continuous learning. The best way to gain confidence is by working on diverse projects that challenge your skills in every phase of the lifecycle.
If you are serious about becoming a professional in this field, I highly recommend enrolling in a comprehensive Power BI Course. Such a program will guide you through these steps with hands-on practice, helping you build a portfolio that proves your expertise to employers.
Conclusion
Building an end-to-end Business Intelligence solution using Power BI is a rewarding process. It combines technical skills like data modeling and coding with creative skills like dashboard design and storytelling.
By focusing on the entire lifecycle—from the initial requirement gathering to the final published report—you ensure that your work is not just a pretty picture, but a powerful engine for business growth.
Remember, start with the business problem, build a clean data model, write efficient DAX, and design for the user. If you follow these principles, you will be well on your way to a successful career as a senior BI analyst.
What do you think is the hardest part of the Power BI lifecycle? Is it the data cleaning or the complex DAX formulas? Let me know your thoughts as you start your journey!


